U.S. Population Estimates for 2018
The U.S. Census released state level single age, race and sex estimates last week.
This is a great data set to spend some time digging into for insights into which demographic forces are driving your State.
Here are some highlights from the data that cover just the national US totals and some comments on trends. The country’s population grew by 0.6 percent in 2018, adding little over 2 million new people from 2017. The entire net increase was in the 21+ LDA category growing by 0.9 percent, while the 21 and under population shrunk by about 76,000 people.
The U.S. continues on a path to growing older; the median age rose from 38.0 in 2017 to 38.2 in 2018. Fertility rates among the general population continue at an all-time low. While it has been a wild ride for the economy, the longest economic expansion on record has simply failed give this younger generation the willingness and/or financial ability to settle down, form households and have children. In fact, only the State of Idaho saw a net increase in the 0-1-year-old populations between 2017 and 2018. Every other state in the country experienced a net decrease. The single age group for 0-1 fell by 45,737 between 2017 and 2018.
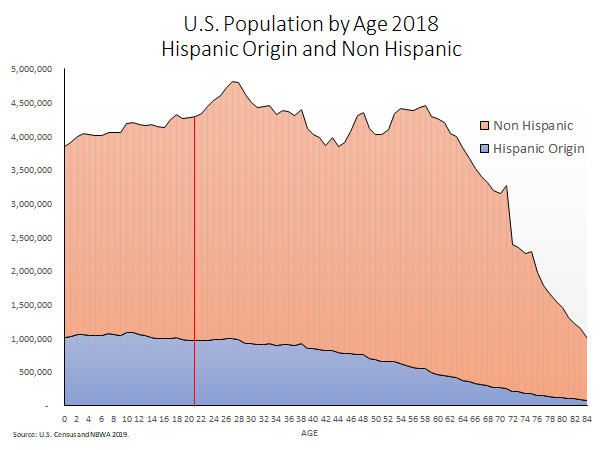
The chart below shows the 2018 US population by single age grouping starting at 0 on the left and progressing to 84 on the right. The highlights that I frequently presented in 2017 remain just as significant in 2018.
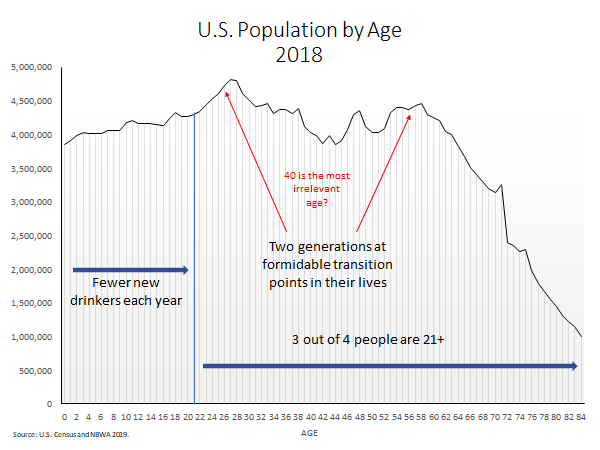
- About the same number of new legal drinking age consumers entered the market in 2018. Roughly 4.3 million people turned 21 in in both years and this trend is expected to continue for a few years. The number will increase slightly in about 5 years and then drop off significantly – barring any significant change in immigration.
- Three out of every four people in the U.S. are now over the age of 21. This will continue to have a significant impact on drug and alcohol policy in 2019 and beyond.
- Both Millennials and Baby Boomers will continue to live though significant life events including new jobs, new homes, retirement and migrations around the country. Think tax law changes and how they impact your state and market.
- Finally, “averages” will be the most irrelevant statistics beer distributors will deal with when managing their markets in 2019. The 38.2 mean U.S. age mentioned above references the least significant age group in the economy. This bimodal distribution of consumers in the marketplace demands that beer distributors are aware and which products and brands work in their local markets. Directives handed down from national suppliers using generic markets statistics will most likely lead to dead ends, frustration and out-of-code beer.
The next table looks at the significant changes in the U.S. population from 2000 to 2010 to 2018.
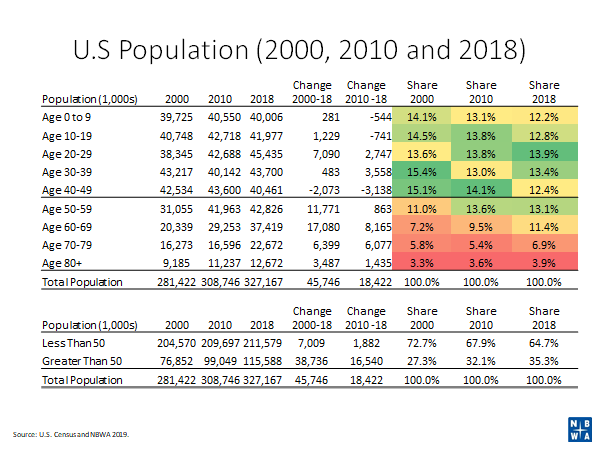
There is a lot to consider here, but let’s start with the big numbers first. From 2000 to 2018 the population grew by over 45 million people and from 2010 to 2018 the population grew from 18.4 million people. Over both time periods, the net increase in population was concentrated in the 50 and older demographic group. From 2000 to 2018, there were 38.7 million net new 50+ persons of out 45.7 million in total. From 2010 to 2018 it was 16.5 million 50+ persons out of 18.4 million in total. Now consider what products have been “hot” in the alcohol beverage marketplace over the past 18 and 8 years? Next, take a look at the 0-9 and 10-19 age groups. In both groups, there are fewer people in these groups in 2018 than in 2010. The share of population has fallen from above 14 percent in 2000 to around 12 percent in 2018. On the opposite end of the age spectrum the opposite trends are unfolding as the 60-69 and 70-79 age groups are growing in absolute numbers and share. This is a dratic shift in consumer demand! Reference post from June 5th, 2019 on Consumer Expenditures and Alcohol.
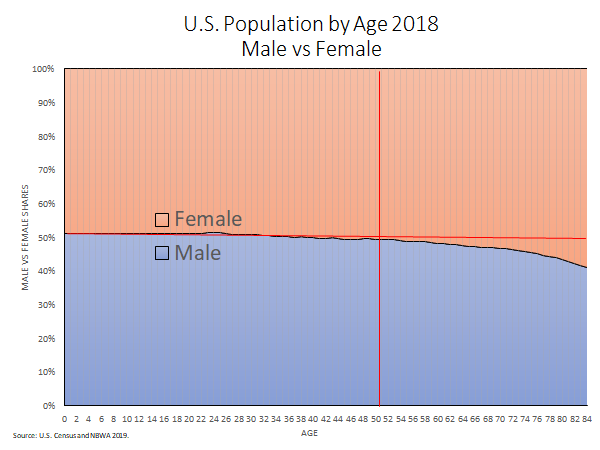
Other data elements from the 2018 data will show the male vs. female share acoss age groups. Consider at the national level as the country grows older, the country also skews more female and more importanly, this difference becomes more promounced after age 50.
Hispanic origin will also continue to be a dominate national force in the years ahead.
The 21 and under demographic group on a national scale well is now above 25% with wide variations around the country.
National statistics such as these will drive national and state policy. However, every state is unique in their own trends, demographics composition, and economy.
Take some time to explore your state’s data and feel free to email or call with any questions, comments and insights.
Here is a link to the entire data set. You will need to use the “Key” information to drill down the the age, race, sex and orgin popualtion counts.
Census Population Estiamtes By Age, Sex, Race and Orrigin by State 2010 to 2018
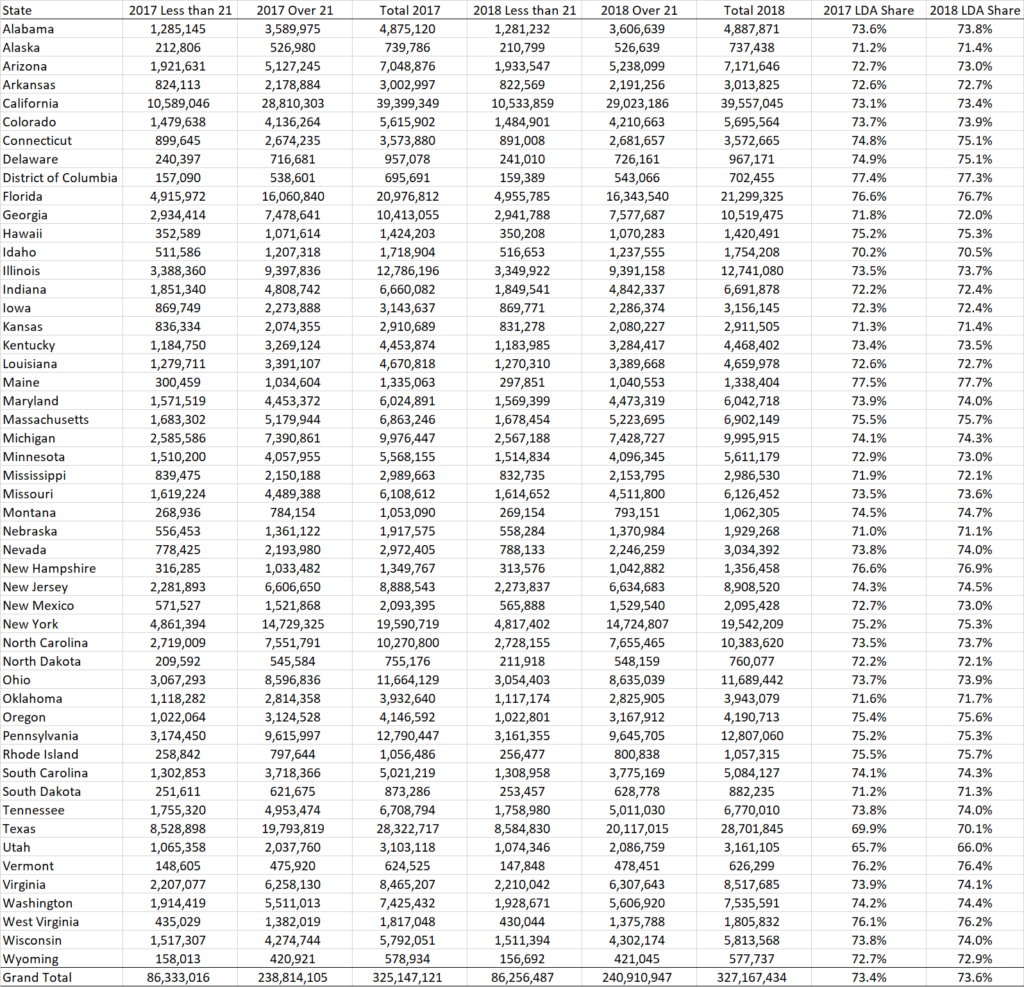
State Populations and LDA Shares