Industry Fast Facts
- In 2023, the U.S. beer industry shipped 192 million barrels of beer (one barrel = 31 gallons or 13.78 24/12 case equivalents). In terms of cases and gallons, in 2023 the U.S. beer industry shipped the equivalent of more than 2.6 billion cases (24/12-ounce containers) of beer equivalent to 6 billion gallons. (Source: U.S. TTB and U.S. Commerce Department, 2024)
- In addition, the industry shipped approximately 2.4 million barrels of hard cider, perry (an alcoholic beverage made from the fermented juice of pears) and other fermented products, equivalent to more than 33 million cases (24/12 ounce containers). (Source: U.S. TTB and U.S. Commerce Department, 2024)
- In 2023, 79% of all beer was domestically produced in the U.S., and 21% was imported from more than 100 countries worldwide. (Source: U.S. TTB and U.S. Commerce Department, 2024)
- In 2023, U.S. consumers aged 21 and older purchased approximately 24 gallons of beer, malt-based beverages and cider per person, according to beer shipment data and U.S. Census population statistics. In 2023, about 249 million people, 75% of the population, are over the age of 21 and are considered legal drinking age. The share of the U.S. population over 21 years old has steadily increased. By comparison, in 2000 the share was 70%. (Source: U.S. Census and NBWA Industry Affairs, 2024)
- In 2023, the U.S. beer industry sold about $135 billion in beer and malt-based beverages to U.S. consumers through retail beer establishments. Approximately 85% of beer sold is through off-premise establishments for at home consumption and 15% is sold on-premise for away from home consumption. (Source: Beer Institute and NBWA Industry Affairs, 2024)
- Draft Beer, beer packaged in kegs and mostly sold through on-premise establishment accounted for 9% of beer sold in the United States in 2023. Packaged beer sold in aluminum cans and glass bottles accounted for 91% of all beer sold in 2023, The aluminum can is the most popular packaging at 60% of total volumes while glass bottles account for 21% of total volume. (Source: U.S. Census, US TTB and NBWA Industry Affairs, 2024)
- The alcohol beverage marketplace and the three-tier system have evolved rapidly over the years. Since 2012, over 3,000 alcohol beverage laws have been passed around the country. In response to the pandemic, many states and local governments have adopted and changed laws and regulations that govern the sale of alcohol sales. (Source: NBWA Industry Affairs, 2024)
Top Beer Holidays in America
(Off-premise, Ranked)
- Independence Day (4th of July)
- Memorial Day
- Labor Day
- Christmas
- Thanksgiving
- The Super Bowl
- Cinco de Mayo
- Halloween
- St. Patrick’s Day
- NCAA Basketball
Beer is the Preferred Beverage of Choice
According to the Gallup Poll, 67% of people (two out of every three people) consume alcohol. Although there have been articles about widespread shifts of legal drinkers from beer to spirits or wine, the annual Gallup survey has shown remarkable stability in consumer preferences for alcoohol consumption over the past decade. In 2022, beer remains the preffered beverage of most 21 and older consumers.
Source: https://news.gallup.com/poll/1582/alcohol-drinking.aspx
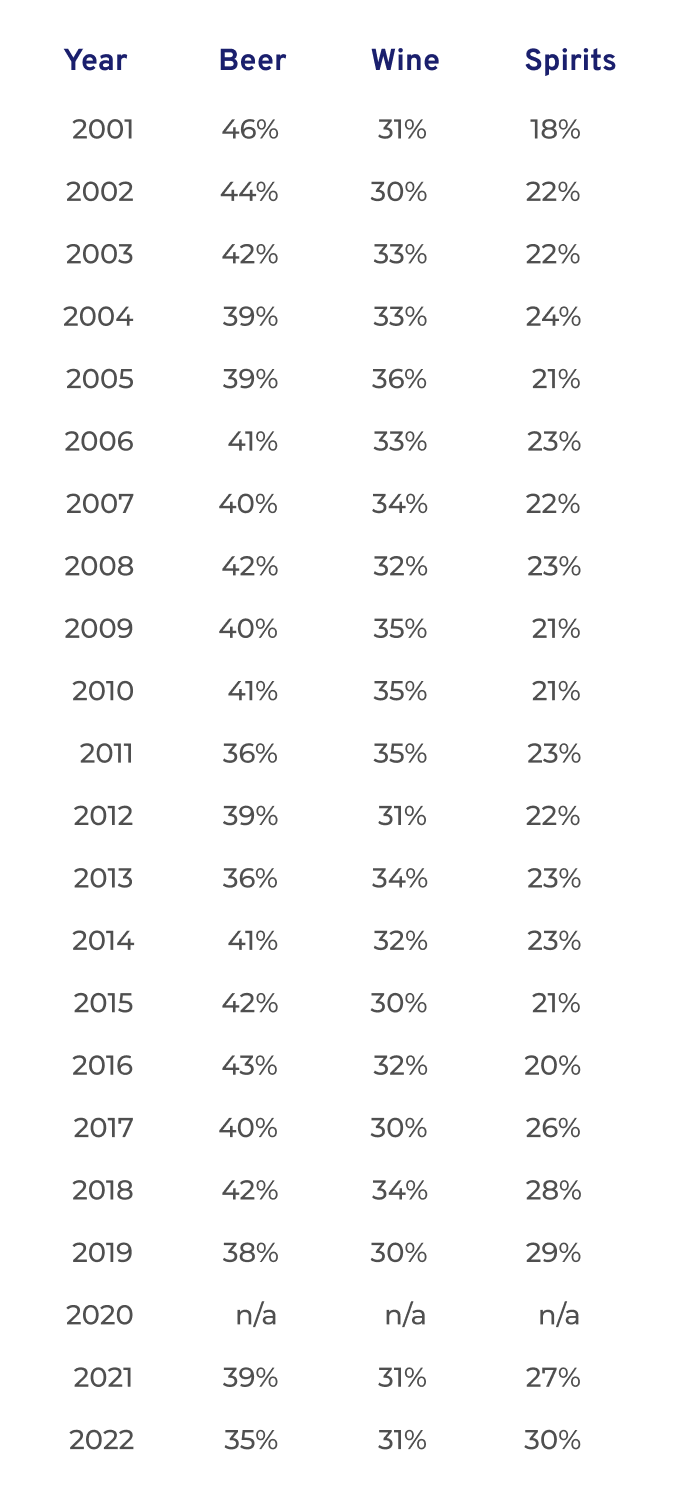
Source: Gallup Poll, July 2022
Number of U.S Breweries – 2023
The industry structure has changed significantly over the past 30 years. In 1983, there were 49 breweries. At the end of 2023, the TTB reported 14,597 approved breweries in the U.S. – an all-time high. Note that not all breweries are open and/or operational. The TTB reported that 485 new brewers’ notices were submitted in CY 2023. Some states now have more breweries than the entire country had in 1990.
| U.S. Tax and Trade Bureau Brewery Count | |||||
| 14,597 Total Brewers December 2023 | |||||
| State | Count | State | Count | State | Count |
| Alabama | 93 | Kentucky | 147 | North Dakota | 33 |
| Alaska | 79 | Louisiana | 78 | Ohio | 602 |
| Arizona | 186 | Maine | 235 | Oklahoma | 108 |
| Arkansas | 90 | Maryland | 206 | Oregon | 459 |
| California | 1,563 | Massachusetts | 355 | Pennsylvania | 819 |
| Colorado | 619 | Michigan | 691 | Rhode Island | 55 |
| Connecticut | 177 | Minnesota | 322 | South Carolina | 172 |
| Delaware | 57 | Mississippi | 35 | South Dakota | 68 |
| DC | 21 | Missouri | 261 | Tennessee | 232 |
| Florida | 598 | Montana | 138 | Texas | 650 |
| Georgia | 244 | Nebraska | 81 | Utah | 65 |
| Hawaii | 52 | Nevada | 76 | Vermont | 118 |
| Idaho | 136 | New Hampshire | 154 | Virginia | 517 |
| Illinois | 455 | New Jersey | 219 | Washington | 694 |
| Indiana | 305 | New Mexico | 159 | West Virginia | 43 |
| Iowa | 177 | New York | 788 | Wisconsin | 407 |
| Kansas | 100 | North Carolina | 597 | Wyoming |
61 |
Source: https://www.ttb.gov/foia/list-of-permittees
Number of Operating/Reporting Breweries – 2023
- Less than half of approved brewers in 2023 file a report of operation. In 2023, there were 7,752 reporting brewery facilities/locations in the U.S. (Brewers must report operations and pay federal excise taxes to the U.S TTB).
- There were only 210 fewer reporting brewers in 2023 compared to 2022, despite an additional 485 new brewery notices filed with the TTB in 2023. Almost a quarter of these breweries were classified as brewpubs that mostly brew beer for direct-to-consumer sale at brewery-restaurant premises. Brewpubs typically brew less than 1,000 barrels (31,000 gallons) of beer per year, though larger chains have emerged around the country.
- In 2023, more than 90% of all U.S. breweries made fewer than 15,000 barrels (465,000 gallons) and accounted for about 3% of total volume. The 924 breweries that reported zero production yet claimed “taxable removals” for the year. These are brewers that produce under “contract” with another brewer.
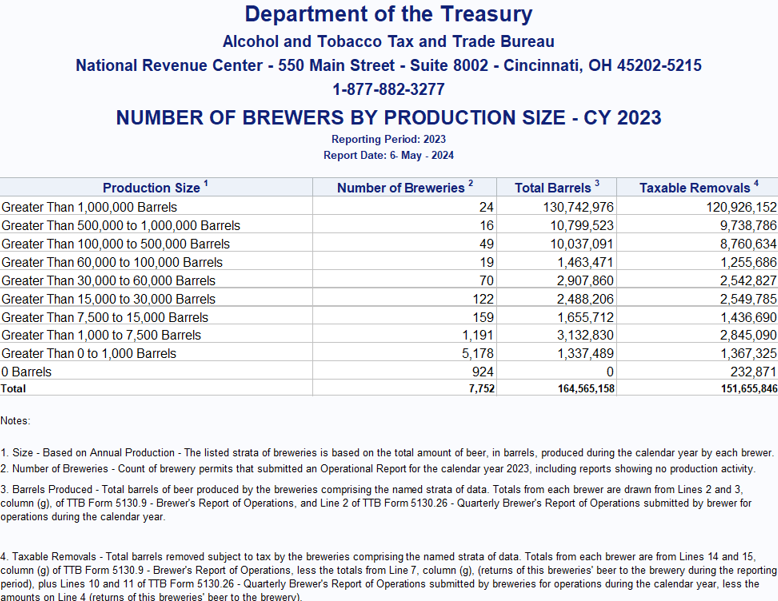
Source: https://www.ttb.gov/beer/statistics
Market Share of Brewers – 2023
The share of the market among brewers and importers has changed significantly over the past ten years. Since 2013, the top two “traditional” brewers have lost about 16 share points to a growing number of successful small brewers and importers. The next group of eight brewers gained 13% of the market, and the remaining “All Other” group gained 4%. The continued growth in small breweries and new innovations in styles and brands makes the U.S. beer market a dynamic and competitive industry.
| Rank | Brewer/Importer | 2023
Share |
2013
Share |
| 1 | AB | 34% | 46% |
| 2 | Molson Coors | 22% | 27% |
| 3 | Constellation | 15% | 6% |
| 4 | Mark Anthony | 4% | 1% |
| 5 | Boston | 4% | 1% |
| 6 | HUSA | 3% | 4% |
| 7 | Pabst | 2% | 3% |
| 8 | Diageo Beer | 1% | 1% |
| 9 | Yuengling | 1% | 1% |
| 10 | FIFCO USA | 1% | 1% |
| Top 10 | 88% | 91% | |
| All Others | 12% | 9% |
Source: Beer Marketer’s Insights, 2023
Structural Change in the Industry
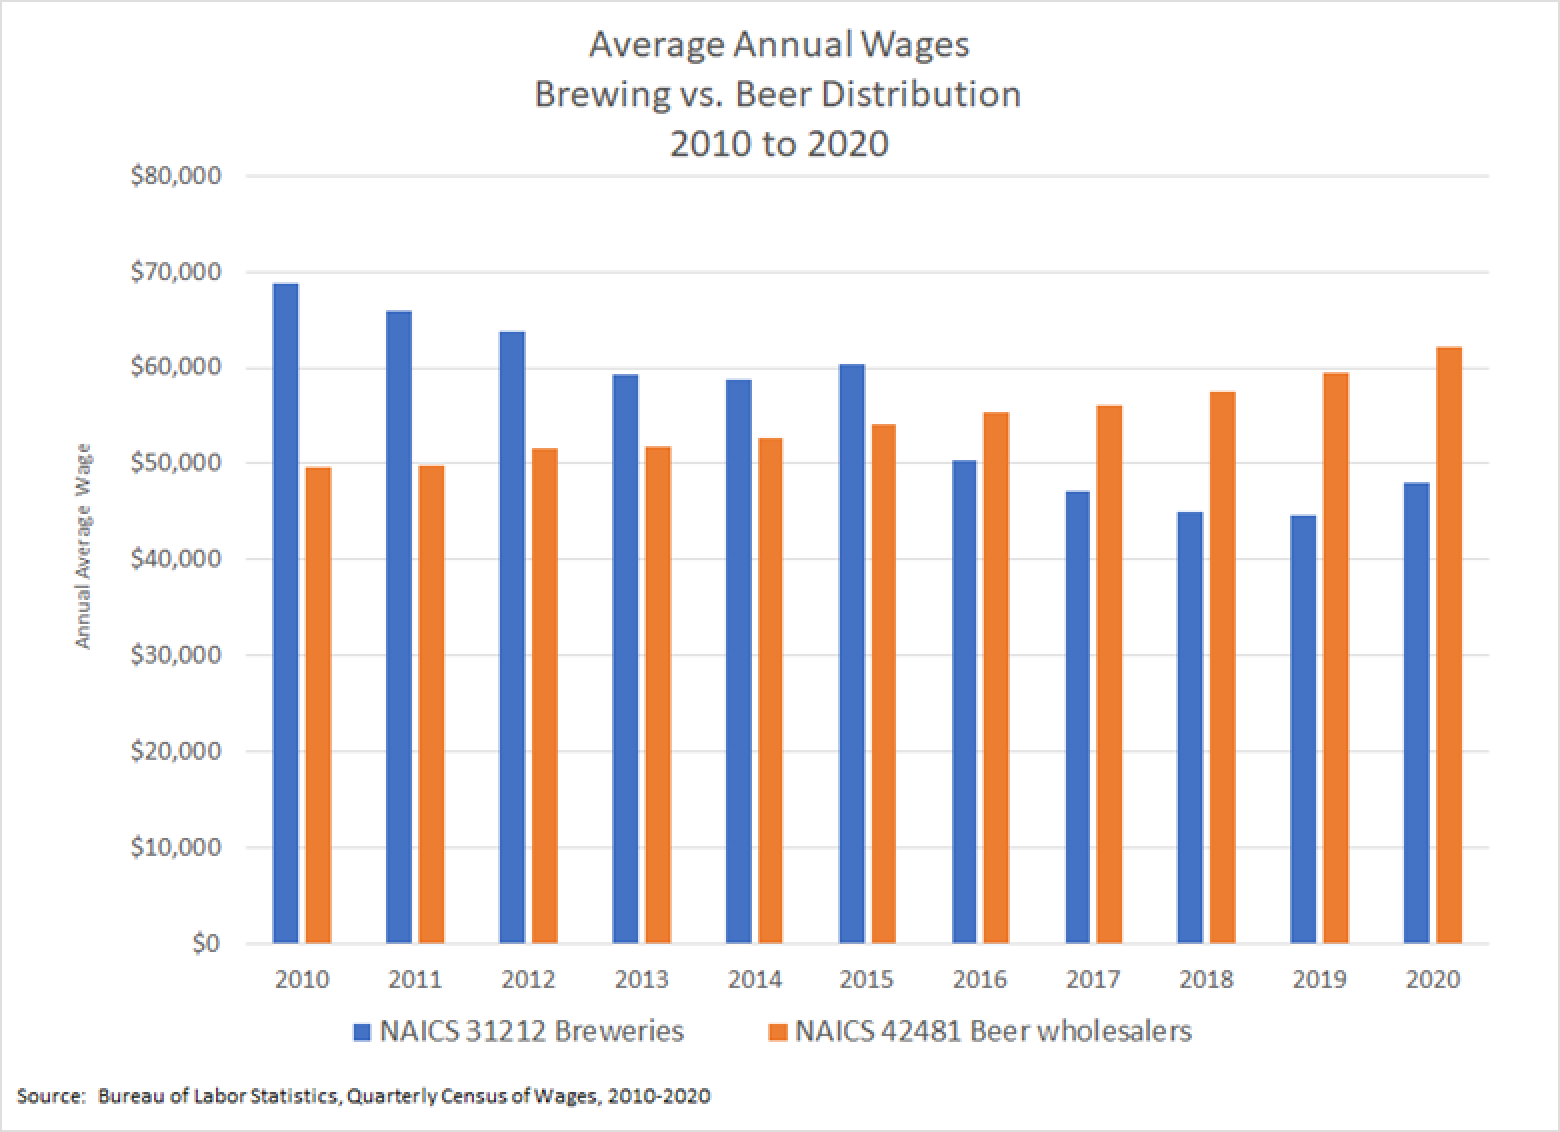
The dramatic change in the basic structure of the industry can be observed in the average annual wages paid by brewers and distributors. The chart below shows the annual average wages reported by the U.S. Bureau of Labor Statistics Quarterly Census of Wages (QCEW). The shift in market share to smaller start-up brewers from larger established brewers shows a consistent pattern of lower annual wages for brewing industry employees. Over the same period, wages paid by beer distributors have kept up with general wage increases.
Beer Distribution
Beer distribution has seen significant changes as well. Over the years, the number of traditional beer distributors has fallen from 4,595 in 1980 to around 3,000 in 2020. However, similar to brewing, the number of new entrants into the alcohol beverage wholesaling sector has increased significantly. According to data from the TTB, there are more than 20,000 licensed alcohol beverage wholesalers. More details about the number of distributors can be found in the NBWA Membership Directory (the directory is only accessible to NBWA Membership). Additional details on jobs, wages, taxes and the economic impacts of beer distributors can be found in the NBWA Distributor Economic Impact Report.

Alcohol Beverage Retail
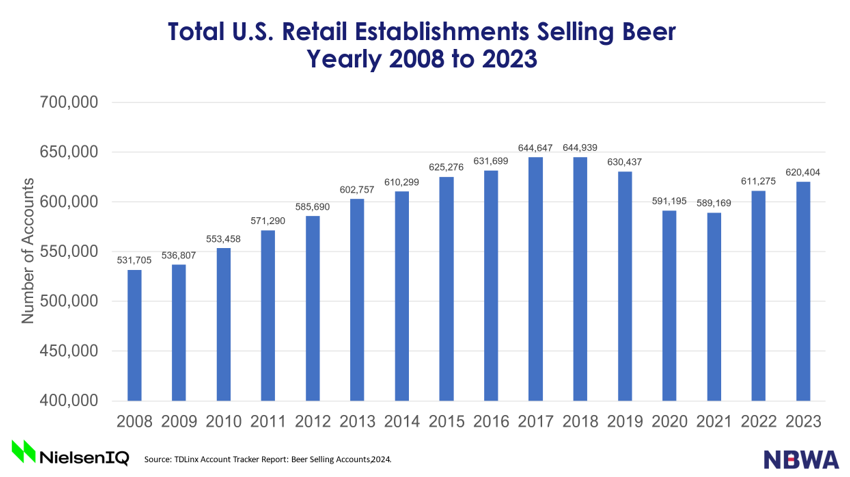
The three-tier system of alcohol beverage regulation requires that beer distributors sell to beer retailers. The number of retail outlets that sell alcohol has grown significantly since the end of the 2008-2009 recession. Total alcohol outlets increased from 531,705 in 2008 to 644,939 in 2018. The beer retail industry has not fully recovered from the impacts of COVID-19 from the loss of thousands of smaller independent on and off premise establishments.