Consumer Expenditures and Alcohol 2010 to 2017
There is a lot of hand-ringing these days regarding the future of alcohol consumption. The coming of age for Millennials over 21 has unfolded in ways that many in the industry did not expect. The observed socio-economic characteristic of this younger generation point to them postponing household formation, marriage, and children. This is not a bad outcome for the future of the beer industry. I maintain that Millennials, like every other generation before them, have the same ultimate goals; to form a household, raise children, have a successful career and enjoy life; the problem is this younger generation is taking a slightly different path to these goals and are facing a different set of challenges than previous generations. How does this play out in the marketplace and what does it mean for the industry?
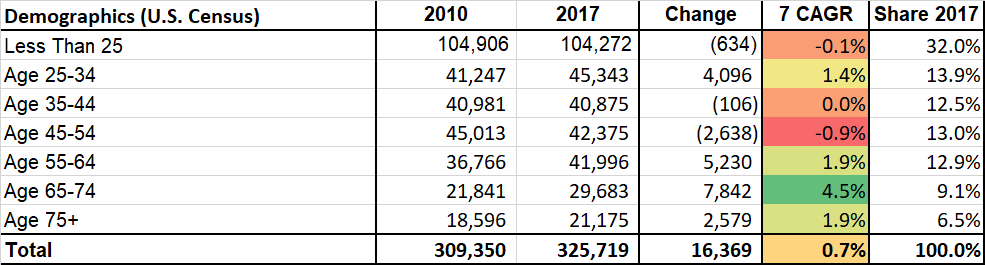
Demographics are Destiny
There are many things about the post-recession period (2010-2018) that we know changed the face of the economy. It is now the longest economic expansion on record at 120 months. More importantly, it has seen a dramatic shift in the sheer number of people represented in each demographic group. In the table below, two demographic groups (LT 25 and 45-54) have shrunk in size since 2010 – stop and consider the implications that there are fewer people in each of these groups in 2017 than in 2010. Meanwhile, the 65+ group now larger and has grown faster and has more people than the younger 25-34 group. Each one of these groups are impacting spending and the economy in different ways.
Consumer Spending
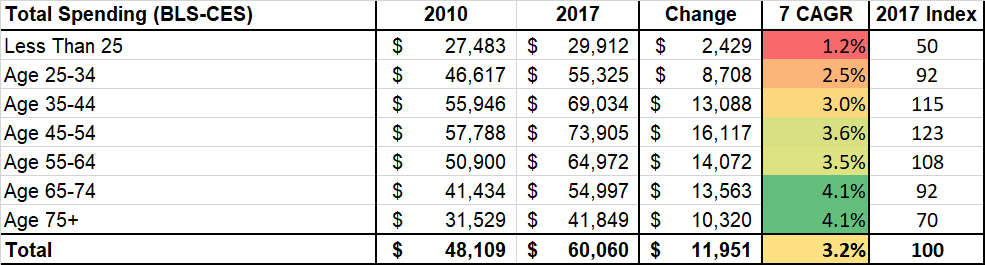
In the context of these demographic groupings, there has also been a profound change in consumer spending. The Bureau of Labor Statistics – Consumer Expenditure Survey lays out these changes over time by age groups for a variety of spending categories including alcohol. This is free data and easily accessible at https://www.bls.gov/cex/ .
In the table below, most of the individual spending power sits with the 45-54 age group – the same group that has shrunk in size from 2010 (also a fundamental reason why GDP growth as been slower paced than prior expansions as consumer spending is two-thirds of GDP). More importantly, the shift in spending across the spectrum shows that the younger demograpics have not experienced the same growth or magnitude of spending as many older Americans in the 65 -74 and 75+ category. This is a basic labor market principle that younger, less experienced workers earn less than older, more experieneced ones. If they earn less, they spend less. Also, worth noting is that while younger consumers are spending below average, they have not yet hit their full earning or spending potential. Ultimately this will change and younger consumers will soon fill the gap left by the relatively smaller 45-54 age group as their income and earning potentials rise.
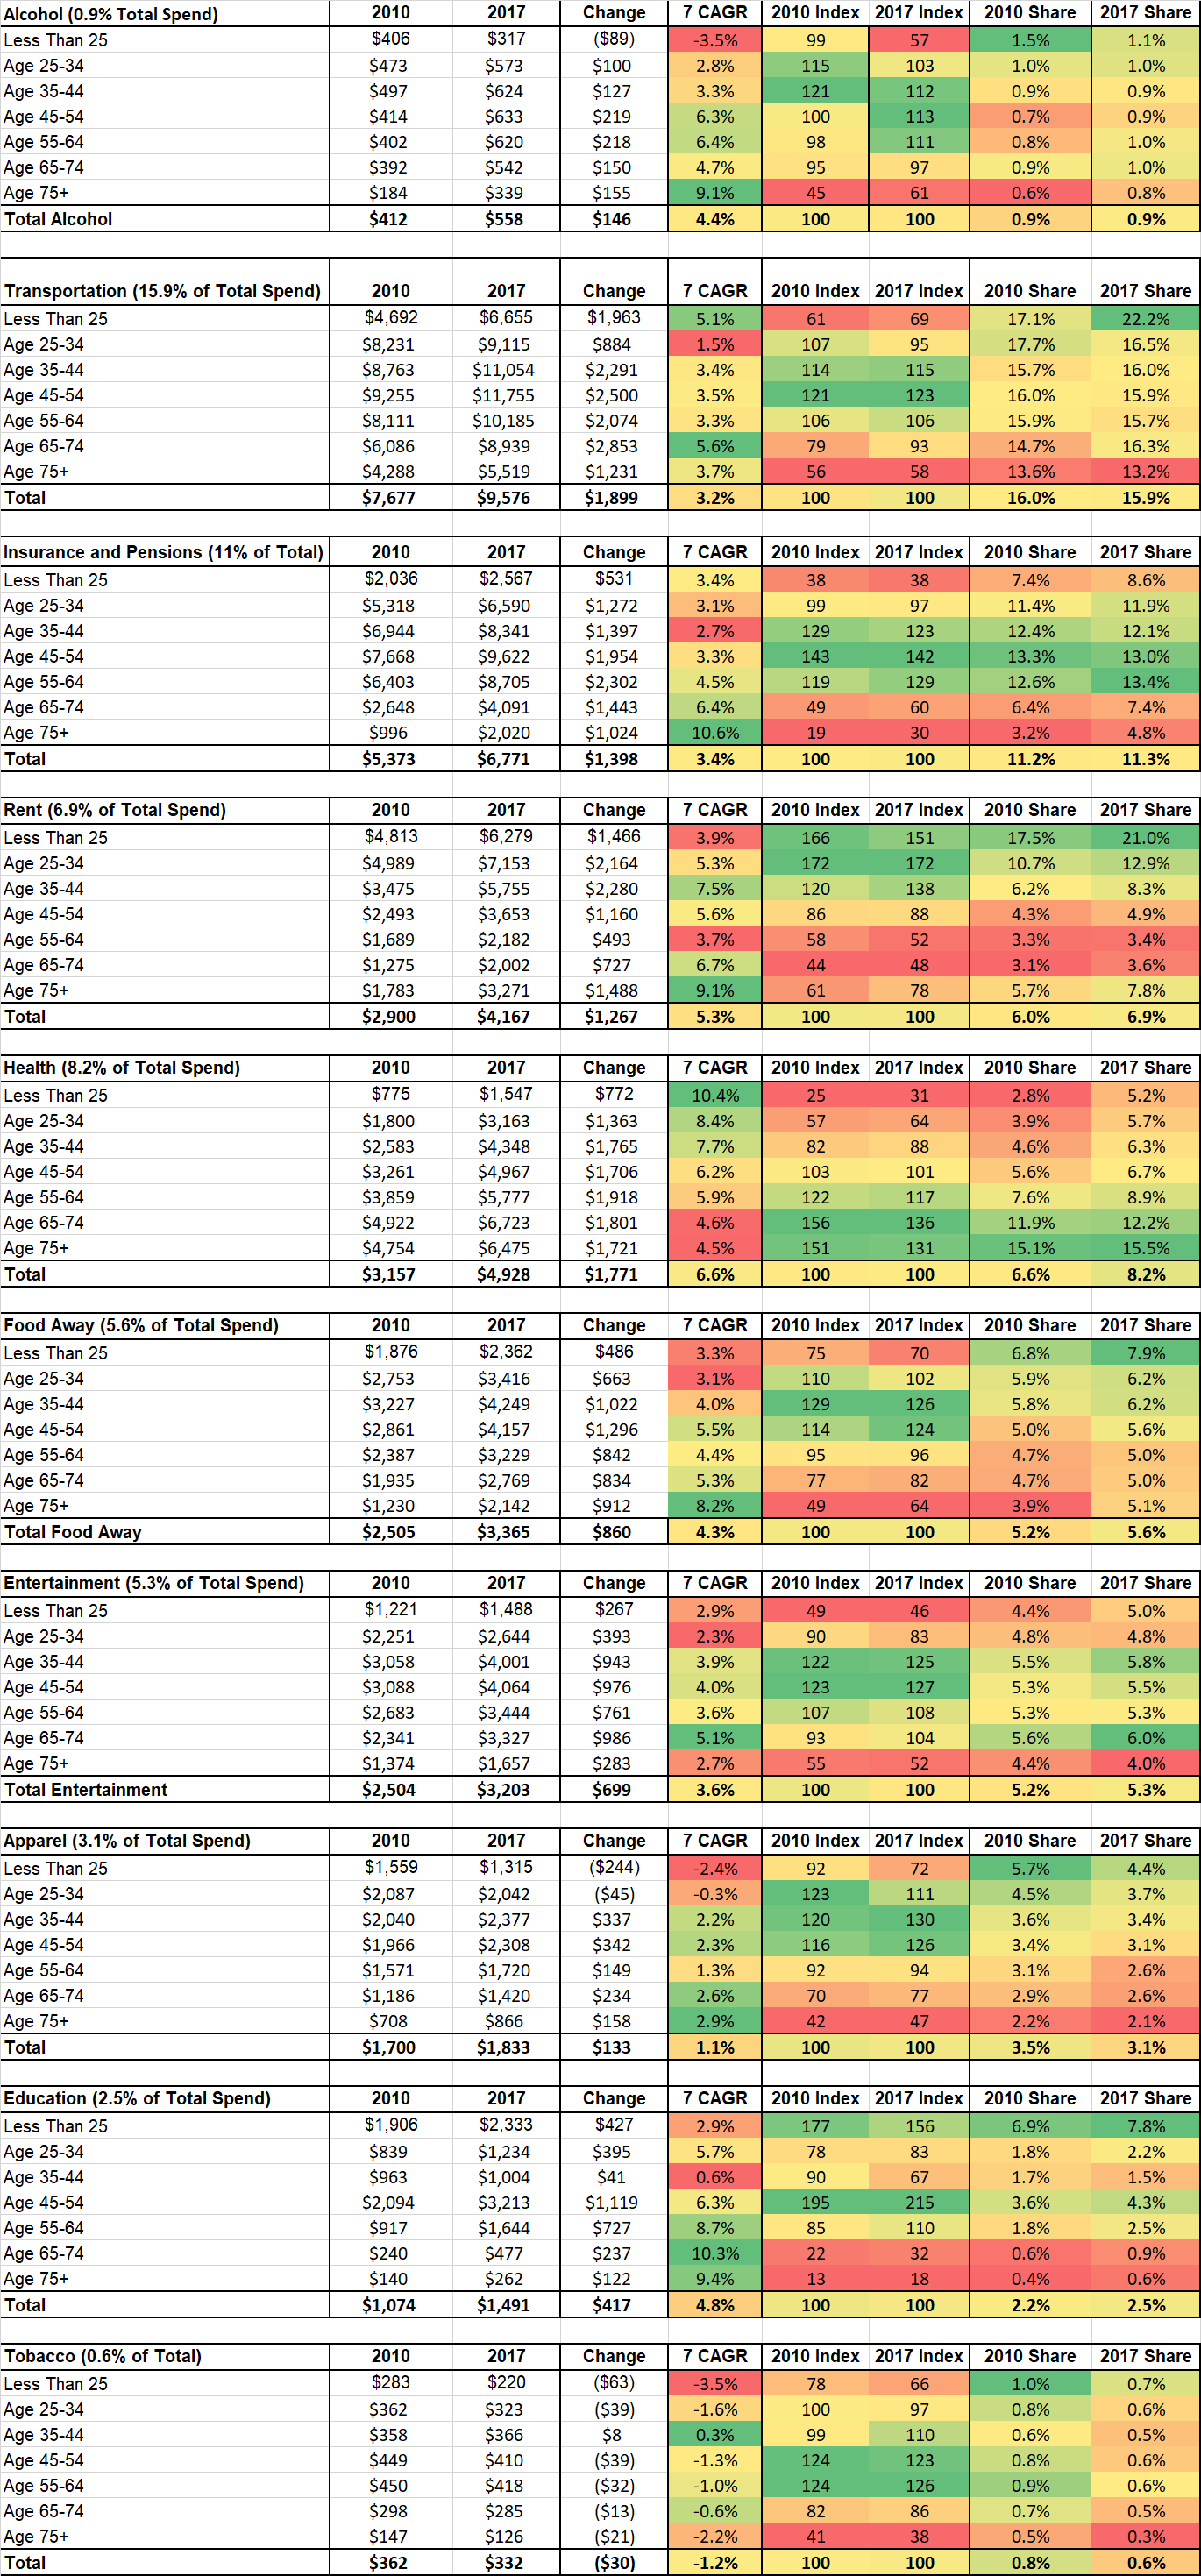
Alcohol Spending
This is where alcohol spending comes into play. Over time U.S consumers have spent a predictable and consistent 1 percent of their disposable income on alcohol – data from the CES survey from 1990 to 2017 show a total share of income consistently around 1 percent of total consumer spending goes to alcohol each year.
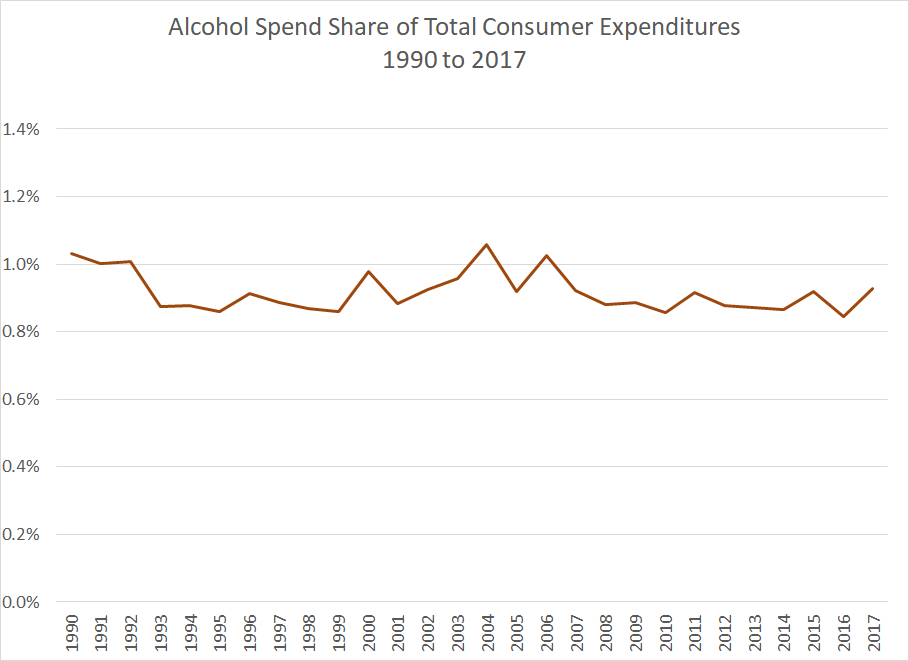
The same outcome is also seen in Gallup Poll data that also shows a relatively stable two-thirds the population ‘find occasions to drink”. I have also made this same point using total per capita alcohol tax collections and total ethanol consumption over time as models show a stable aggreagte level of consumption, which can be viewed here.
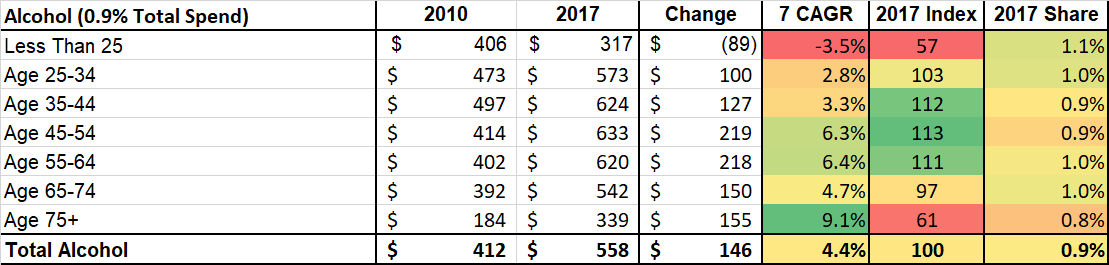
While the total population consistently spends the same share on alcohol over time, the shift in who, what, and where the spedning occurs is changing dramatically! The data in the table below shows that spending on alcohol by age group has shifted from younger demographics into older demographics in a significant way. The magnitude and growth of alcohol spending follows the total spending pattern with ages 65+ showing the highest growth in spending. They are also the largest demographic group. Meanwile the smaller (diminised) 45-54 group is the higest average spender in general. This is a dramtic shift among age groups of consumers, but overall the total spending shares remains the same.
What is driving the decline in alcohol spending by younger consumers and fueling expansion in older consumers?
A deep dive into the consumer expenditure tables will help tell the story. For younger consumers, rent, entertainment, eating out, education, transportation and health care have all taken bigger bites out of their total expenditure budget since 2010. This is a forced budgetary constraint imposed by the marketplace on consumers and their lifestyles. Moreover, the growth of high-end beverages and a focus on local craft has forced a decline in total volumes while consumers manage to keep their budgets balanced. This is actually a good sign for the economy and the alcohol beverage marketplace. Younger consumers have a great potential to impact the alcohol beverage market as they balance increases in current expenditures across the board. The alcohol beverage marketplace as changed dramatically over the years. There are more suppliers, more distributors and more retailers than every before. Since 2012, 1,830 pieces of alcohol-related state legislation have been signed into law across the country. This is not an archaic, prohibition-era system. Laws change every year to help the industry grow and to accommodate new technologies, new business models and new consumers.
The economy will see an absolute increase in total spending as every consumer moves into the next stage of their lives. This will translate into an absolute increase in spending on alcohol following a steady 1 percent share of total expenditures. The end is not near for alcohol or beer, it’s the beginning.
More Tables to Explore: