More Products, More Occasions, More Outlets
While there is a lot of discussion from outside the alcohol category about people consuming less and the negative impacts on consumer demand, the data seems to indicate otherwise. Overall demand for alcohol remains stable and predictiable among U.S consumers with more suppliers, more products, more occasions, more outlets, and even more innovations in the pipeline.
While case volumes are down slightly, the places to buy and consume alcohol surprisingly continue to grow. Over the past ten years, the industry has seen consistent growth in the number of retail establishments that sell alcohol beverages, both brick and mortar outlets as well as virtual (e-commerce) outlets.
According to data from Neilson TDLinks™, total alcohol selling establishments have grown to from 530,000 in 2008 to over 640,000 in 2018. New occasion opportunities from movie theaters and barber shops, to laundry mats and even libraries – primarily experience-focused outings – are on the rise as well.
In addition, the continued growth in the number of small brewers, vintners and distillers around the country has doubled in the past ten years. Today there are now more than 25,000 permitted alcohol manufacturers in the country. Breweries alone accounted for 10,115 permits at the end of 2018 and most of the new brewers are operating as retail brewers selling direct to consumers. The U.S. Tax and Trade Bureau’s FY2018 Annual Report provides an in depth look into the dynamics of the alcohol beveage industry. https://www.ttb.gov/foia/pdf/ttbar2018.pdf
As the alcohol beverage industry fragments, it becomes more difficult to reliably and accurately track. The data in the table (figure 1) show domestic and imported malt beverages as reported by the U.S. Alcohol and Tobacco Tax and Trade Bureau (TTB) and the Department of Commerce. At the time of publication, the fourth quarter numbers for domestic beer and cider are preliminary and are subjust to revision.
In addition to the malt beverage volumes, cider, perry and mead, an alcohol beverage segment category called “NESOI” has been included which stands for “Not Elsewhere Specified or Included.” (NESOI beverages are the fermented alcohol beverages that simply do not fit into any traditional category and are lumped together into an obscure import account reported out by the Department of Commerce.) This category is a small share of total industry, but just like every other disruptive beverage, it will invade the core beer space and grow faster than the balance of the industry. Domestic products like “Great American Carolina Clear” that have no clearly defined segment defintion based on its ingredients, continue to push the boundaries of the industry.
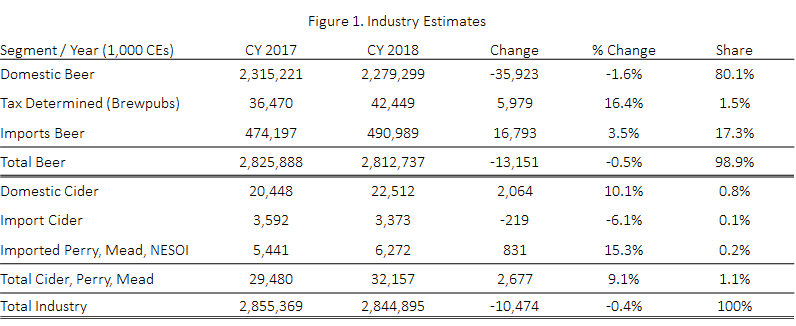
Despite all this “activity” across the entire alcohol beverage industry, beer industry volumes continue to trend downward. In figure 1, core domestic beer business fell by 1.6 percent. Imports grew by 3.5 percent adding 16.8 million cases. And, tax determined (brewpubs) grew at 16.4 percent and added 6.0 million cases. In the cider category, total volumes grew by almost 10 percent adding 2.7 million cases to the market. The shift to specialty domestic brands and specialty imports is driving growth in the cider segment. Overall an expanded view of the industry shows case volumes were only down slightly in 2018 falling 0.4% over 2017.
Growing the High-End
The push to grow the high-end beer market is also not letting up any time soon. The U.S. economy is entering its 119 month of economic expansion that started in June 2009. This current expansion will soon pass the 120-month record set during the March 1991 to March 2001 business cycle.
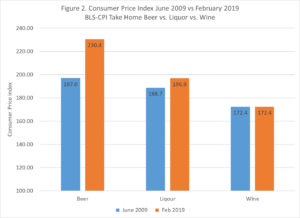
Alongside the growing economy, the push to create a high-end beer market. In 2010 about 25 percent of beer was sold in high end segments. The high-end share has changed dramatically, today over 40 percent of beer is sold in the high segment. This shift into higher end products has not been lost on consumers. Data from the Bureau of Labor Statistics Consumer Price Index shows how dramatic the increase in high-end has been relative to wine and liquor.
In figure 2, the Consumer Price Index (CPI) for beer for take home consumption was 197 in June of 2009 compared to 230 in February 2019; this represents a 17 percent increase over 117 months of the economic expansion. By comparison, over the same time period, the price index for take-home liquor category rose by 4% and the price index for take-home wine remains virtually the same as in June 2009.
Total Alcohol Consumption Remains the Same
The past ten years may have seen significant change in who, what and where alcohol beverages are consumed. But, how much the country drinks has remained relatively the same each year during the current economic expansion.
The data in figure 3 shows the total amount of alcohol the country consumes each year has remained relatively the same at 2.5 gallons per person per year from 2009 to 2018. This stable and rather predictable level of consumption of total alcohol holds true among many states across the country.
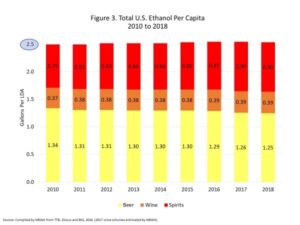
The total alcohol estimate is calculated by taking the average weighted alcohol by volume (ABV) for beer, cider, wine and liquor in each year and dividing by the legal drinking age population. The growing number of craft brewers and craft distillers over the years has led to a growing number of products in the marketplace that offer higher ABV products in general. The average ABV for beer has increased from 4.6 percent to 4.7 percent and liquor has increased from 37.8 percent to 38.5 percent between 2010 and 2018. After accounting for an increasing number of higher ABV products, across the segments and more legal drinking age adults overall, the final estimates for per captia consuption remains the same each year.
More outlets, more products, more occasions and a fixed level of per capita demand means the industry will contiue to see more innovation and competetion in the year ahead.